🗺️ Maps Overview
The Map is the main visual workspace of the MapBilling platform.
It shows all Water and Waste assets in one interactive view.
🌍 1. System Map Overview
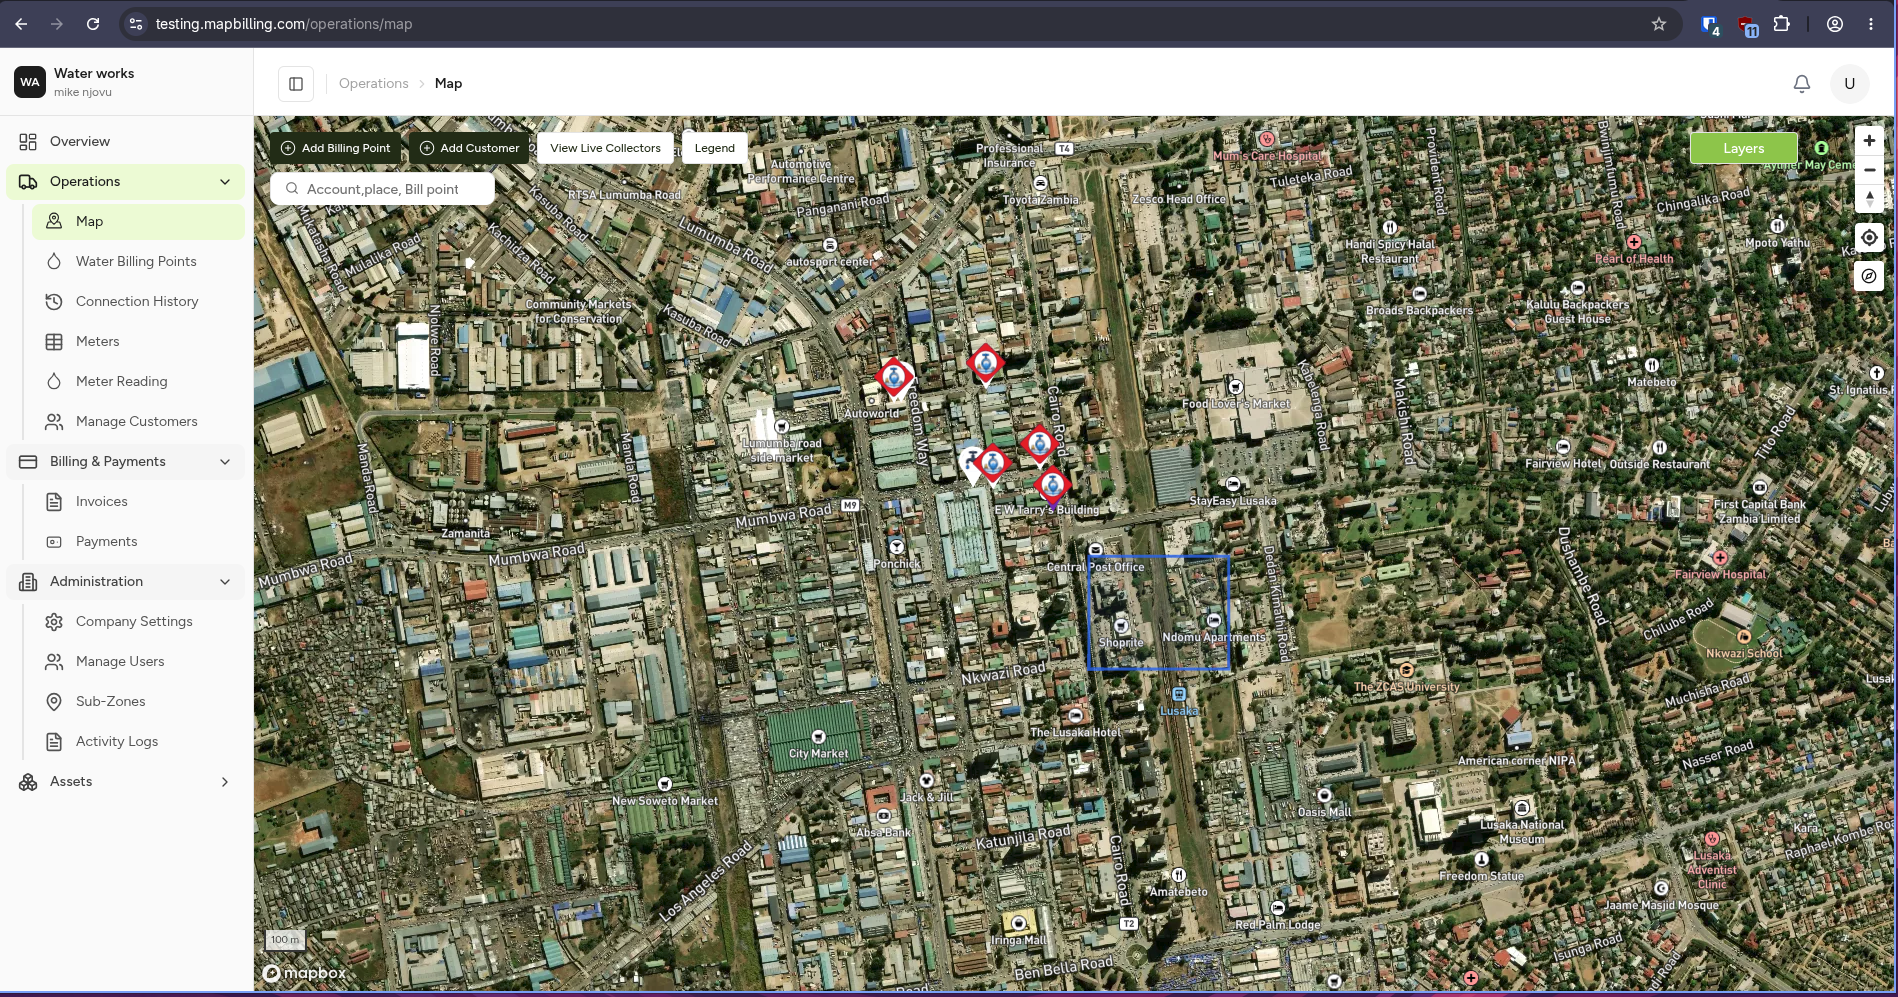
This is how the system map looks when opened.
📌 It combines all assets into a single live view.
🧭 2. Map Interface Breakdown
The map interface is divided into key sections:
Key Areas
- 🧭 Left Panel → Filters & Layers
- 🗺️ Center → Interactive Map
- 📊 Right Panel → Asset Details
- 🔍 Top Bar → Search & Tools
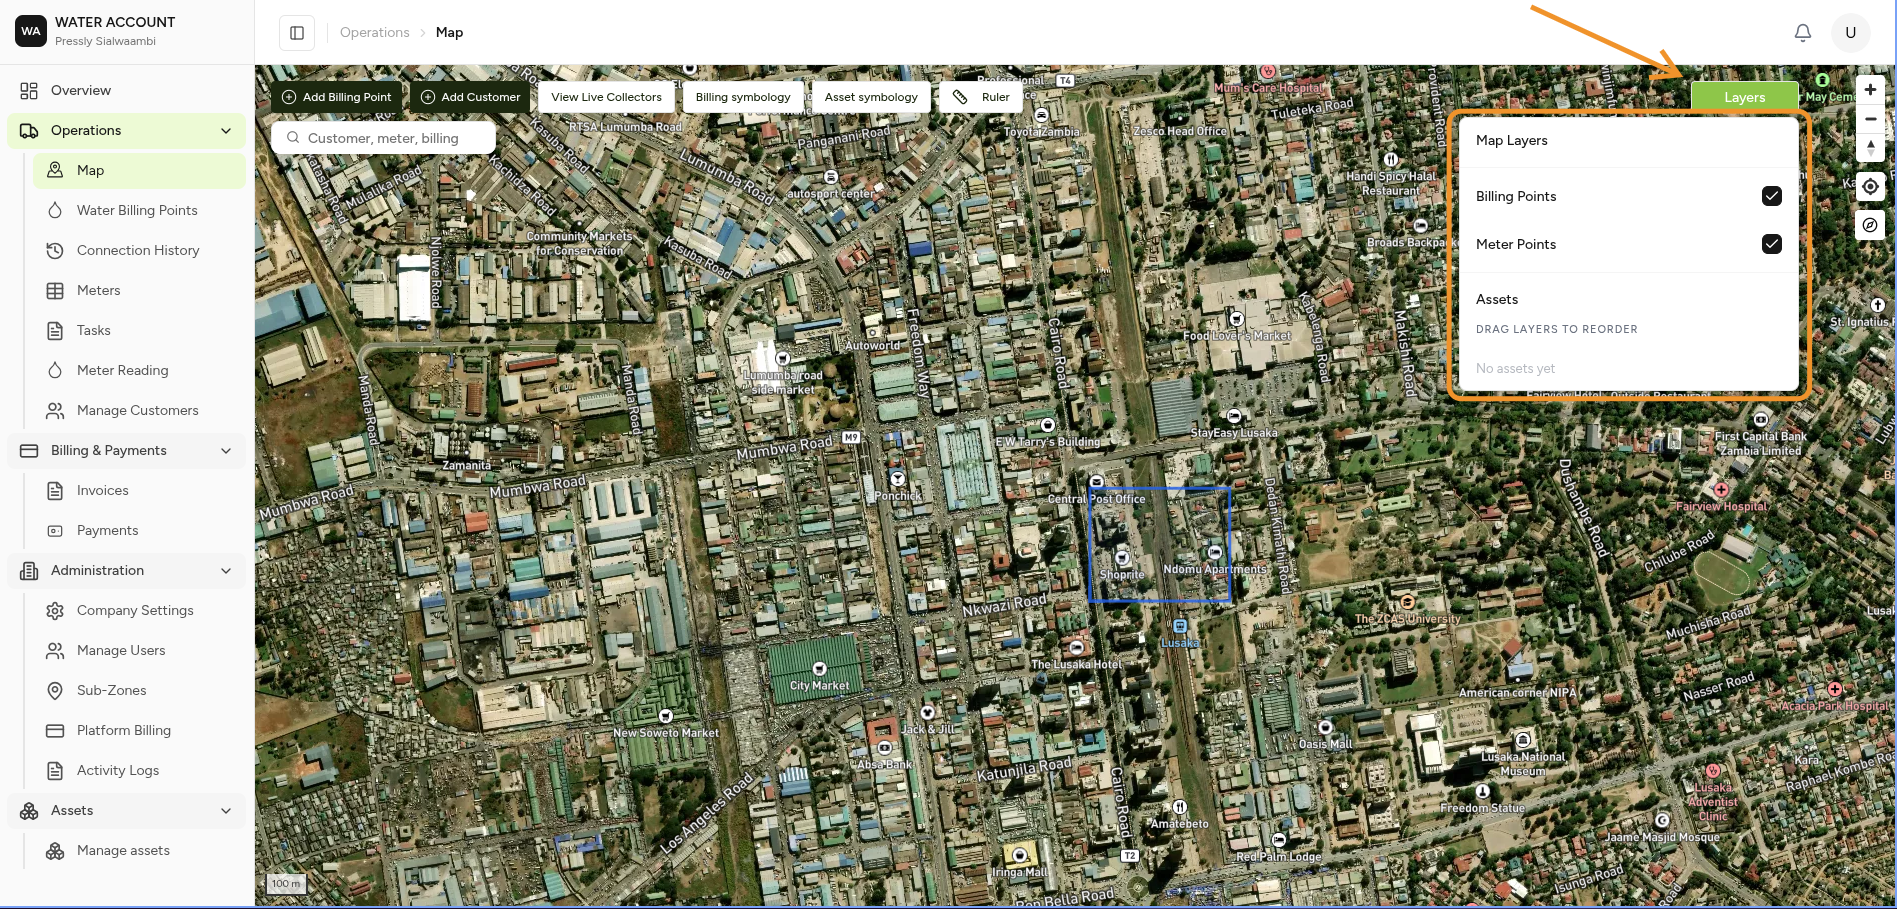
🧩 3. Map Layers
Layers allow you to control what is visible.
💧 Water Layer
Includes:
- Meters
- Pipes
- Tanks
🗑️ Waste Layer
Includes:
- Bins
- Routes
- Collection zones
📍 Operational Layer
Includes:
- Field work
- Inspections
- Tasks
🔍 4. Selecting an Asset
Clicking any item on the map opens its details.
You can see:
- Asset name
- Type
- Status
- Location
- Last update
- Related records
🎯 5. Filtering Assets
Filters help you narrow down what you see.
Filter by:
- Asset type
- Region
- Status
- Date updated
🧠 6. Map Clustering (Large Data Sets)
When many assets exist, they are grouped into clusters.
Behaviour:
- Zoom in → clusters break apart
- Zoom out → clusters group together
📍 7. Real-Time Field Updates
When field workers update data, the map updates instantly.
Examples:
- Meter reading updated
- Bin marked as collected
- Asset status changed
🧭 8. Typical Workflow (Visual)
flowchart TD

A[Open Map] --> B[View Layers]
B --> C[Apply Filters]
C --> D[Select Asset]
D --> E[View Details]
E --> F[Update / Action]
F --> B